
Representational image. PHOTO: REUTERS
ISLAMABAD: The good news is that attempts to curtail the external deficit are bearing fruit.
In FY19, trade and current account deficits were brought down to $31.82 billion and $13.59 billion respectively from $37.58 billion and $19.89 billion respectively in FY18.
In the first two months of the current fiscal year (FY20), the trade deficit sat at $3.97 billion, which was $2.4 billion or 37.6% less than the $6.37 billion trade imbalance registered in the corresponding period of the preceding year.
The bad news is that the reduction in external deficit has been made possible by a substantial fall in imports and not by an uptick in exports. After imports came down $6 billion (10.9%) in FY19, the trend continues into FY20, as the first two months saw a drop of $2.13 billion (27.8%) in imports year-on-year.
Exports, however, remain stagnant. During FY19, exports fell $240 million while in FY20 (July-August), they went up to $270 million year-on-year.
Pakistan’s export base remains narrow as it has been unable to take full benefit of the European Union’s (EU) GSP Plus scheme. The 28-member bloc is Pakistan’s largest export market, accounting for nearly 34% of the country’s global exports. The GSP Plus grants duty-free market access to more than 6,000 tariff lines (TLs) from Pakistan and a few other developing countries. In the case of Pakistan, more than 78% of exports, including the all-important textile and clothing (T&C) sector, to the EU are covered by the GSP Plus.
The EU’s average applied most favoured nation (MFN) tariffs on textile and clothing are 6.5% and 9.5% respectively. However, under the GSP Plus, almost the entire T&C sector is entitled to duty-free access.
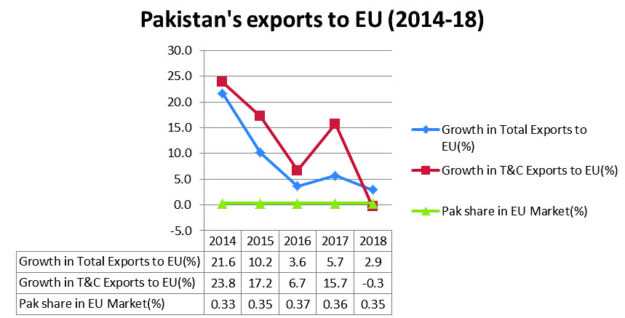
According to European Commission data, in 2014, the first year of the GSP Plus treatment, Pakistan’s exports to the EU went up to €5.51 billion from €4.53 billion in 2013, an increase of 21.63%. However, this healthy growth could not be maintained.
In 2015, exports to the EU registered 10.16% growth and reached €6.07 billion. Next year saw further deceleration in export growth that came in at 3.62% as exports sat at €6.29 billion.
In 2017 and 2018, exports to the EU grew 5.72% (€6.67 billion) and 2.90% (€6.90 billion) respectively. During 2017 and 2018, the EU’s global imports grew at healthy rates of 8.8% and 6.6% respectively. Therefore, the slowdown in Pakistan’s export growth to the EU can’t be put down to deceleration in the EU’s global imports.
Pakistan’s share in the EU market jumped from 0.27% in 2013 to 0.33% in 2014. However, in subsequent years, the share stuck around 0.35%.
Since the T&C sector has the lion’s share in Pakistan’s total exports to the EU, the growth of Pakistan’s exports to the EU market depends largely on the performance of this important sector.
In 2014 and 2015, while benefiting from the duty-free market access, the T&C exports to the EU grew substantially by 23.8% and 17.2% respectively. However, in the following years, the growth rate could not be maintained.
In 2016, T&C exports grew by 6.97%. In 2017, the growth rate went up to 15.7%. However, in 2018, T&C exports registered a negative growth of 0.13%.
Why did after strong growth in 2014 exports register comparatively weak growth in subsequent years? One reason may be exchange rate movements.
In 2014, on average, one euro exchanged for 1.33 dollars; in 2015 as well as in 2016, the exchange rate came down to 1.11 before going up marginally to 1.13 in 2017 and further to 1.18 in 2018. On the other hand, during 2015-17, the rupee remained overvalued. A depreciating euro coupled with an overvalued rupee may have made Pakistan’s exports more expensive in the EU market. However, the fall in growth of exports can’t be set down to the exchange rate.
In 2014, 2015, 2016, 2017 and 2018, extra EU imports (imports of EU countries from the rest of the world) were €1,692 billion, €1,730 billion, €1,712 billion, €1,853 billion and €1,980 billion respectively. This shows that despite the depreciation of the euro, the EU’s global imports went up 17% between 2014 and 2018.
In fact, in 2017, the EU’s global imports increased by 8.8% compared with 5.7% growth in its imports from Pakistan. Likewise, in 2018, the EU’s global imports increased by 6.6% compared with 2.9% growth in imports from Pakistan. In 2018, the rupee depreciated massively but exports to the EU registered a nominal growth.
Causes of slowdown
We, therefore, need to look at domestic, particularly supply-side, factors for the slowdown in the growth of Pakistan’s exports to the EU from 2015 onwards.
An important contributor is a fluctuation in cotton output. In 2014-15, cotton production went up 9.32% to 13.96 million bales from 12.76 million bales in 2013-14. However, in 2015-16, the production went down 29.96% to 9.91 million bales before increasing 7.6% to 10.67 million bales in 2016-17 and further to 11.93 million bales in 2017-18. Thus, between 2013-14 and 2017-18, the cumulative cotton production contracted 0.83 million bales or 6.5%. The area under cotton cultivation went down from 3.05 million hectares to 2.70 million hectares in the past one decade.
Why despite being the key export crop, cotton is being grown on a shrinking area? The major reason is that being a Kharif crop, cotton competes with sugarcane for cultivation, that is to say, farmers can grow either sugarcane or cotton on their scarce land.
Every year, the government fixes the support price for sugarcane, which is normally higher than the price the growers will get under competitive market conditions. The greater the sugar output, the more benefits do the growers get. The support price induces farmers to grow more sugarcane at the expense of cotton and thus at the expense of exports. Due to the generous price support, the sugarcane production went up from 63.9 million tonnes (MT) in 2007-08 to 83.3 MT in 2017-18.
Similarly, sugar output increased from 4.7 MT to 6.6 MT during this period. The area under sugarcane cultivation increased from 1.24 MH to 1.34 MH.
Likewise, the production of cotton yarn, which registered 8.6% growth in 2013-14, grew 1.1% in 2014-15, 1.4% in 2015-16, 0.7% in 2016-17 and 0.1% in 2017-18.
The production of cotton cloth, which registered 0.7% growth in 2013-14, grew 0.1% in 2014-15, 1.2% in 2015-16, 0.4% in 2016-17 and 0% growth in 2017-18, according to State Bank of Pakistan (SBP) data.
Although there are more than 6,000 TLs in the EU’s GSP Plus, only in case of a few hundred TLs Pakistan’s exports to the EU are more than $1 million each. After T&C, raw hides and skins are Pakistan’s second-largest export category for the EU.
However, the export of raw hides and skins to the EU is stuck around €450 million over the past five years. Thus, a narrow export base has prevented Pakistan from driving substantial benefits from the duty-free market access.
GSP Plus entails the elimination of import duties only. All other import restrictions, commonly known as non-tariff measures, particularity product standards, continue to apply. Collectively, these standards are called sanitary and phytosanitary (SPS) measures and technical barriers to trade.
EU countries, together with the US, are known for their stringent product and packaging standards designed to protect the consumer and environment. Pakistani exporters often find it difficult to comply with these standards.
The writer is an Islamabad-based columnist
Published in The Express Tribune, September 23rd, 2019.
Like Business on Facebook, follow @TribuneBiz on Twitter to stay informed and join in the conversation.


COMMENTS
Comments are moderated and generally will be posted if they are on-topic and not abusive.
For more information, please see our Comments FAQ