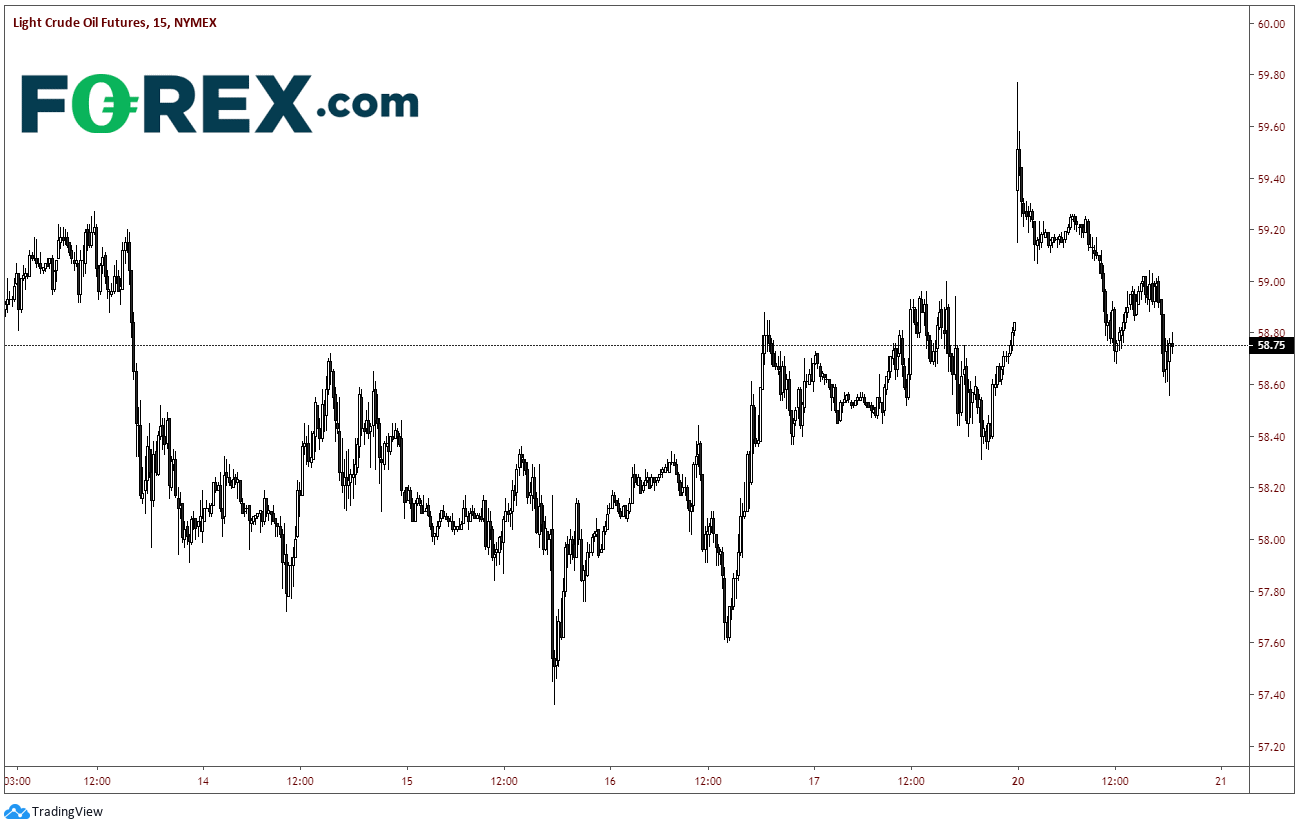
The U.S. equity and bond markets were closed yesterday in observance of Martin Luther King Jr. Day, however the FX markets w reeopen, as well as the overnight session (which is abbreviated) for many futures products. When the crude futures markets opened last night in the U.S., they gapped higher from a Friday close of 58.58 per barrel to 59.77 per barrel. Supply disruptions in Libya and Iraq over the weekend were the culprits for the price jump.
In Libya, military forces shut down a key pipeline. In Iraq, workers protested over working conditions, shutting down an oil production facility halting oil supply. Price has since pulled back and filled the gap, however WTI is still up 0.4% on the day near 58.75 per barrel.

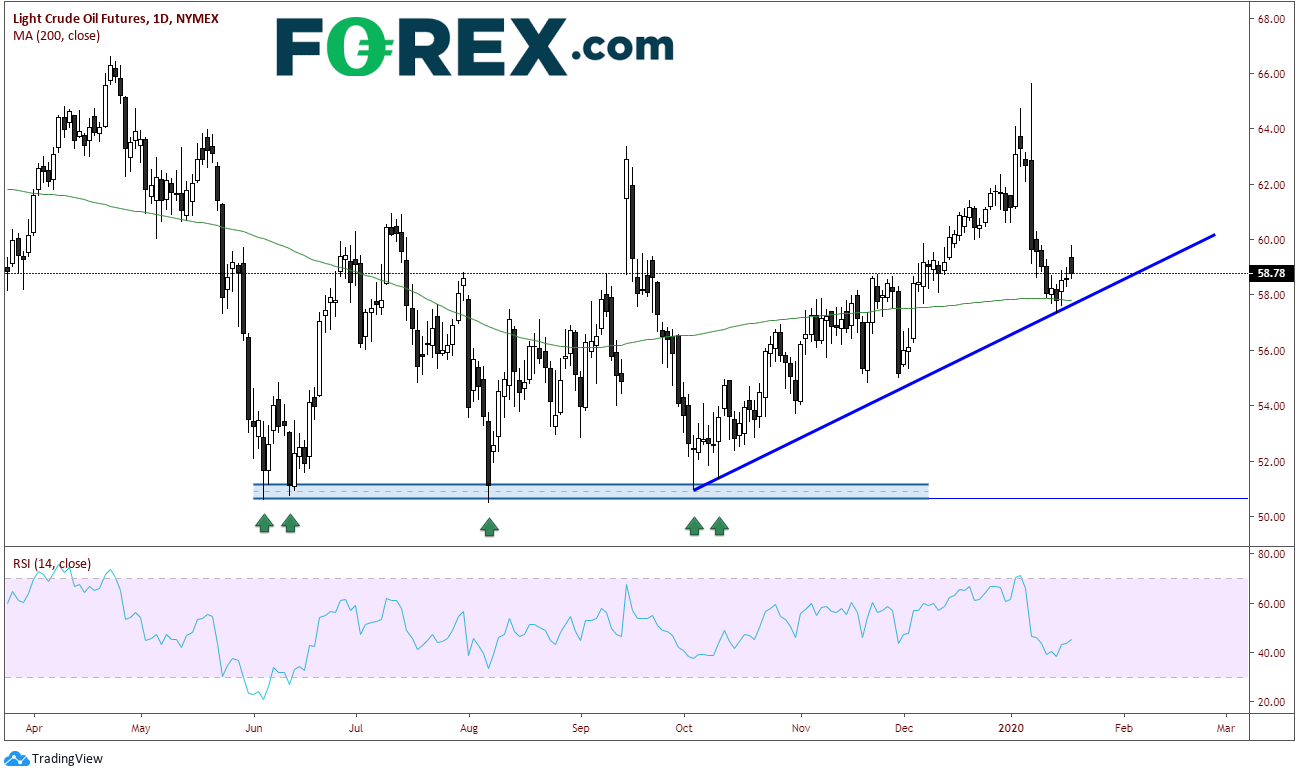
Geopolitical events have been the focus since the beginning of 2020 for the oil markets, in particular, between the U.S. and Iran. On January 8th, WTI traded as high as 65.65 as Iran attacked U.S. military bases in in Iraq. However, markets faded the move higher and closed at 59.61, down 5% on the day!
Over the course of the next few days, price continued to trade lower, however support at the 200-day moving average near 58.00 held. In addition, there is an upward sloping trendline from the October 1st lows which also held near 58.00. On a daily timeframe, today the price action in crude formed a black bearish candle after the gap higher.


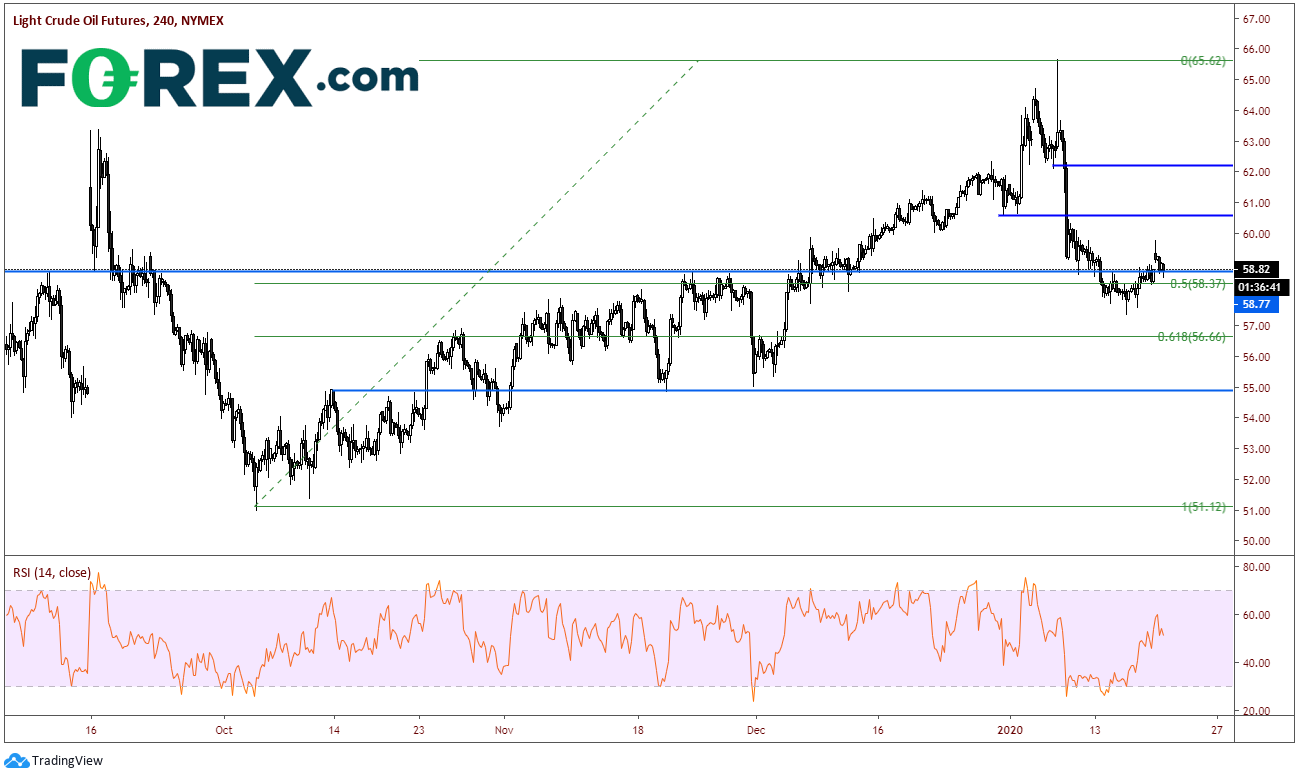
On a 240-minute time-frame, WTI not only support from the daily timeframe, but also the 50% retracement level from the lows on October 3rd to the spike high on January 8th, again near 58.00. If price can continue to hold this level, horizontal resistance above comes across near 60.65 and 62.50. Above that, resistance comes across that the previously mentioned spike highs near 65.65. First support is confluence of indicators mentioned near 58.00. Below that is the 61.8% Fibonacci retracement level of the previously mentioned timeframe near 56.65 and horizonal support near 55.00. Further support is the October 3rd lows near 51.00.
Continue to watch the 58.00 level for WTI. It has proved to be good support in the near-term. In addition, notice that moves higher since the beginning of the year due to geopolitical events have tended to be faded. Is this a trend?
Also, as mentioned here, Davos begins this week on Wednesday. Watch for comments which may be market moving. We also have the usually weekly API and DOE data due out Wednesday and Thursday respectively, (delayed 1 day due to the U.S. holiday).
