These are among the findings in the Child Opportunity Index 2.0, a mammoth database unveiled today, January 22, by Brandeis University in Waltham, Massachusetts. The project examines the 100 largest metro areas in the United States, including Denver, at a granular level, neighborhood by neighborhood, to reveal the sort of inequality set before many young people, particularly children of color.
Denver is no exception. "One of the implications is that a large chunk of Denver's adult population will reflect the condition these kids, including Hispanic kids, are growing up in — and Hispanic kids are not having the best opportunities," says Dolores Acevedo-Garcia, director of the Institute for Child, Youth and Family Policy at The Heller School for Social Policy and Management at Brandeis, as well as a driving force behind the index. "That's one of the main reasons it's very important that we address these very significant areas of inequity that we have in neighborhoods by race."
At the same time, Acevedo-Garcia stresses that Denver is hardly the most egregious example of this phenomenon: "In Colorado, we find the gaps are relatively low compared to the rest of the country."
This apparent contradiction is explained by the index's methodology. Brandeis researchers examined 72,000 U.S. Census tracts across the country. These plots tend to be smaller than most urban neighborhoods; Five Points, for example, consists of around three census tracts. Data was then collected in association with 29 so-called indicators grouped into three domains: education, health and environment, and social and economic. Each factor was then weighted according to its perceived noteworthiness, with the results combined to create a single opportunity score between 1 and 100. The bottom of the scale represents "the 1 percent of kids in the U.S. who live in the neighborhoods with the lowest opportunity scores," Acevedo-Garcia allows, "and 100 is the top percent of neighborhoods for opportunity — the best conditions for kids in the U.S."
The gulf between these extremes was enormous in some cities, Acevedo-Garcia acknowledges. "There are places like Detroit, where neighborhoods with very low opportunities have a score of only 2 and the highest opportunity neighborhoods have a score of 90. But in Denver, you have neighborhoods with very high opportunities that score a 95, and others with very low opportunities that score 21. That's a gap of 74, which is obviously very wide, but since we have other areas of the country that have a gap of 90, Denver is doing relatively well in that sense — although you always want to improve the lowest opportunity neighborhoods."

Denver is not a level playing field, the study shows.
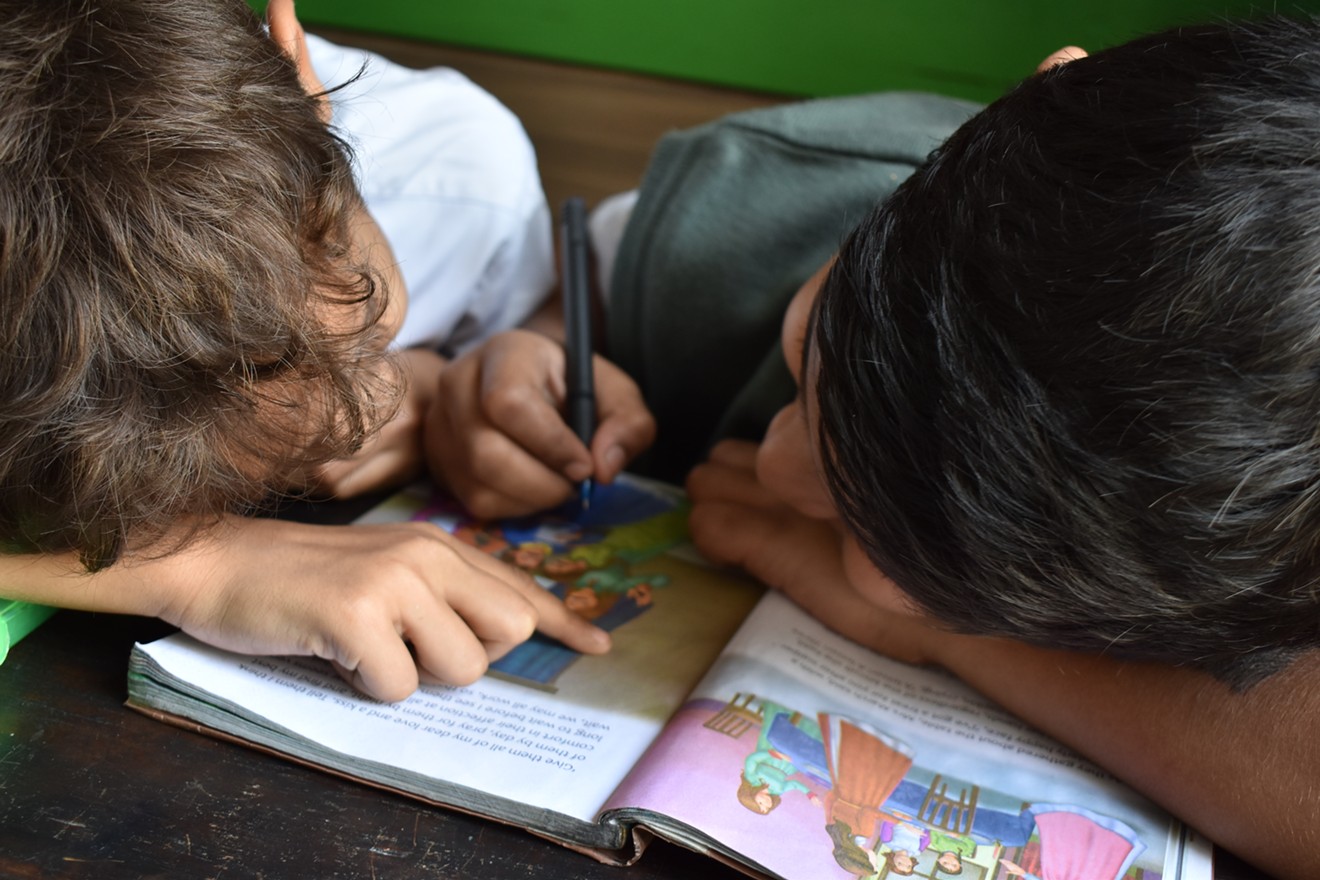
Photo by Cassie Gallegos on Unsplash
Very low opportunity neighborhoods: 21Likewise, the average opportunity scores of neighborhoods by race/ethnicity are hardly the worst in the nation, but still worrisome:
Low opportunity neighborhoods: 46
Moderate opportunity neighborhoods: 71
High opportunity neighborhoods: 88
Very high opportunity neighborhoods: 95
Hispanic children: 39The opportunity differences are made more clear when the aforementioned categories are applied to the assorted ethnicities. As you'll see, relatively few white kids and (to a lesser extent) Asian/Pacific Islander youngsters live in the lowest opportunity neighborhoods, while a clear majority of black and Hispanic children do.
Black children: 46
Asian/Pacific Islander children: 74
White children: 85
White children:
Very low opportunity neighborhoods: 5.9 percent
Low opportunity neighborhoods: 13 percent
Moderate opportunity neighborhoods: 22.6 percent
High opportunity neighborhoods: 28.2 percent
Very high opportunity neighborhoods: 30.3 percent
Asian/Pacific Islander children:
Very low opportunity neighborhoods: 17.1 percent
Low opportunity neighborhoods: 17.3 percent
Moderate opportunity neighborhoods: 23.7 percent
High opportunity neighborhoods: 22.6 percent
Very high opportunity neighborhoods: 19.3 percent
Black children:
Very low opportunity neighborhoods: 34.0 percent
Low opportunity neighborhoods: 35.7 percent
Moderate opportunity neighborhoods: 17.8 percent
High opportunity neighborhoods: 8.5 percent
Very high opportunity neighborhoods: 4.0 percent
Hispanic children:The following map and accompanying graphic offer a comparison between the neighborhoods where white and Hispanic kids in Denver live. They show that Hispanic children (depicted in purple) tend to be clustered in lower opportunity neighborhoods on the northern end of the metro area, represented by white or light blue on the map, while white youths (designated by green) are typically found in higher opportunity neighborhoods colored in darker hues. The bar graph, meanwhile, reveals at a glance that the percentage of Hispanic children in lower opportunity neighborhoods dwarfs that of white kids, while the situation is reversed in the higher opportunity tracts.
Very low opportunity neighborhoods: 41.8 percent
Low opportunity neighborhoods: 27.2 percent
Moderate opportunity neighborhoods: 15.9 percent
High opportunity neighborhoods: 8.3 percent
Very high opportunity neighborhoods: 6.9 percent

This map and accompanying graphic show that more than 65 percent of Hispanic children in Denver live in low or very low opportunity neighborhoods, while over 50 percent of white children reside in high or very high opportunity neighborhoods.
Acevedo-Garcia points out that this six-year contrast isn't as poor as the one for America as a whole. Overall, she says, "there's a difference of about seven years of life expectancy from very low and very high opportunity neighborhoods — from 75 to 82. But our hope is to bring everyone up in terms of life expectancy, and there's definitely room for improvement in Denver."
The same goes for Denver's performance as a whole.
"Like most areas in the country, Denver has a very unequal distribution of kids by race across the five opportunity levels," she allows. "And when you see that only about 5 percent of white kids live in very lower opportunity neighborhoods, but 40 percent of Hispanic kids do, you can see that we need to do better."
Visit diversitydatakids.org to explore Child Opportunity Index 2.0.


