Up Almost 1.4x Since March, Xilinx Stock Overpriced?

Despite a 38% rise since the March low of this year, at the current price of around $95 per share we believe Xilinx stock (NASDAQ: XLNX) has reached its near term potential. Xilinx manufactures semiconductor devices used across a wide variety of sectors such as aerospace, defense, AI/ML, data center, and communications. XLNX stock has rallied from $69 to $95 off its recent bottom compared to the S&P which moved a similar 40%. On the way down, XLNX stock had taken a beating of around 24% going from $91 to $69, a rate lower than the S&P 500, which fell by about 34%. Further, the stock is still up around 14% from its early 2019 levels, over a year ago.
XLNX stock has soared past the level it was at before the drop in February due to the coronavirus outbreak becoming a pandemic. This seems to make it fully valued as, in reality, demand and revenues will likely be lower than last year.
XLNX stock rose over the past year primarily due to a 28% jump in revenue, which combined with a roughly unchanged outstanding share count, translated into a 27% rise in revenue per share. Further, the company has seen a rise in profitability, with EPS over this period going from $1.86 in 2018 to $3.15 in 2020 (Xilinx’s fiscal year ends in March). EPS rose in 2019 and 2020 due to a significantly lower effective tax rate (4.9% in 2020 and 8.1% in 2019 vs 32.9% in 2018).
- Rising 21% This Year, What Lies Ahead For Exxon Stock Following Q1 Earnings?
- Should You Pick General Electric Stock At $165?
- What’s Next For JetBlue Stock After A Sharp 19% Fall Post Q1 Results?
- Is Kimberly-Clark Stock Fairly Valued At $135 After A Solid Q1?
- How Will AMD’s AI Business Fare In Q1?
- Up 9% Year To Date, Will Chevron’s Gains Continue Following Q1 Results?
While the company has seen revenue rise 28% over recent years, its P/S multiple has dropped 10% from 8.4x in 2018 to 7.6x currently. Further, we believe the stock is unlikely to see significant upside despite the recent rally, owing to the potential weakness from a recession driven by the Covid outbreak. Our interactive dashboard What Factors Drove 14% Change in Xilinx Stock between 2018 and now? has the underlying numbers.
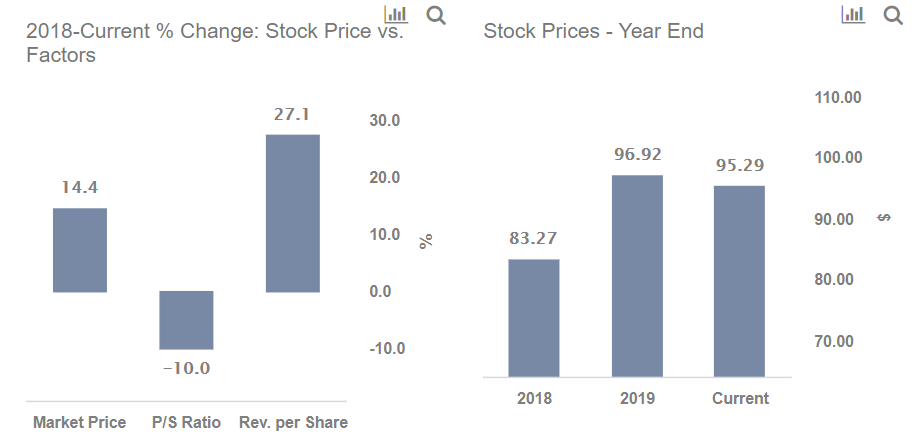
Xilinx’s P/S multiple was at 8.4x in 2018, and currently stands at 7.6x. However, there is further downside when we consider the current scenario, and compare it with P/S multiple levels seen in recent years: 5.5x in 2016 and 7x as recently as 2017.
So what’s the likely trigger and timing for this downside?
The global spread of Coronavirus has meant there is expected to be a drop in demand from some of the sectors that use Xilinx’s semiconductor products, namely demand from the automotive, industrial, aerospace, and defense industries. However, given the surge in online activity and data center usage, demand from the data center, communications, and AI/ML sectors could see a rise. However, the overall impact that this could have on Xilinx’s revenues and margins remains to be seen. We believe Xilinx’s Q1 results in July will paint a clearer picture.
Regardless, if there isn’t clear evidence of containment of the virus at the time of the earnings announcement, we believe the stock will see its P/S decline from the current level of 7.6x to around 6.3x (the average of levels seen in 2016 and 2017), which combined with a slight reduction in revenues and margins could result in the stock price shrinking to as low as $78.
While Xilinx stock doesn’t seem to have much near term upside, which S&P 500 component stocks have the best chance of outperforming the benchmark index? Our 5 In the S&P 500 That’ll Beat The Index: TWTR, ISRG, NFLX, NOW, V look promising.
Our dashboard forecasting U.S. Covid-19 cases with cross-country comparisons analyzes expected recovery time-frames and possible spread of the virus. Further, our dashboard -28% Coronavirus crash vs. 4 Historic crashes builds a complete macro picture.
The complete set of coronavirus impact and timing analyses is available here
See all Trefis Price Estimates and Download Trefis Data here
What’s behind Trefis? See How It’s Powering New Collaboration and What-Ifs For CFOs and Finance Teams | Product, R&D, and Marketing Teams