Semiconductor foundry Tower Semiconductor (NASDAQ:TSEM) stock is in a sweet spot has the pandemic induced global chip shortage has fostered outsized capex investments by chipmakers to quickly bridge the gap between supply and overwhelming demand. This is exceptionally bullish for semiconductor foundries (FABs). While 80% of the world’s chips are produced by Taiwan Semiconductor (NYSE:TSM) and Samsung (OTC:SSNLF), there’s plenty of demand to go around for smaller players like Tower. Tower also specializes in chips for the automotive industry, which is one of the most widely publicized sectors being adversely affected from the shortage. The mass COVID vaccinations are getting the nation ever closer to reaching levels of herd immunity and accelerating the re-opening momentum. Investors seeking exposure in a key player to benefit from the global rebound in semiconductors for 5G infrastructure and automotive can watch for opportunistic pullback levels to scale into a position.
Q4 Fiscal 2020 Earnings Release
On Feb. 17, 2021, Tower Semiconductor reported its Q4 2020results for the quarter ending December 2020. The Company reported earnings-per-share (EPS) of $0.34 versus consensus analyst estimates for $0.33, a $0.01 beat. Revenues grew 12.9% year-over-year (YoY) to $345.1 million, beating analyst estimates for $340.9 million.
Q1 Fiscal 2021 Guidance Top Line Raised
The Company issued Q1 2021 revenue guidance in the range of $327.75 million to $362.25 million versus $330.10 million consensus analyst estimates. This represents 15% YoY growth, with organic growth of 20% YoY. The Company also expected to see sequential revenue growth for the rest of 2021.
Conference Call Takeaways
Tower Semiconductor CEO, Russell Ellwanger, provided a breakdown of the 2020 revenues:
“Infrastructure revenue, which predominantly is our RF optical, with a certain amount of advanced discretes, was about $230 million. Wireless was approximately $425 million. Automotive was $180 million, we which serve with power ICs, power discretes, imaging and RF radar. Consumer, including computing, power management for home appliances and general accessories, and home-use security cameras was approximately $220 million. Industrial was approximately $100 million. Image sensors for high-end photography and medical applications was $50 million. Aerospace and defense was $50 million.”
The Company enjoys a greater than 60% market share in the advanced optical transceivers segment, through its silicon germanium infrastructure business under its Analog unit.
Data traffic growth is expected at a 15% CAGR rate:
“Our opportunity to mirror this growth and benefit from both the continued rollout in 5G infrastructure, which drives demand for 25 gigabit per second transceivers in telecom networks and by data center build-out, which drives demand for 100 through 800 gigabit transceivers.”
CEO Ellwanger anticipates the growing adoption of its silicon photonics platform at the 400 and 800 gigabits per second rate, which should bolster further growth in the optical market along with new opportunities.
5G and Optical Tailwinds
The Company has begun volume production in its partnership with network products maker Inphi (NASDAQ:IPHI) with over 30 customers “engaged at various stages of qualification and development.” The explosive growth in bandwidth demand is a major tailwind for the Company. This demand is part of the new normal, with video conferencing, streaming content, mobile and wireless growth which will all be bolstered by the 5G rollout and adoption. Tower Semiconductor is in the sweet spot of both the rebound of the automotive segment and acceleration of the optical segment.

TSEM Opportunistic Pullback Levels
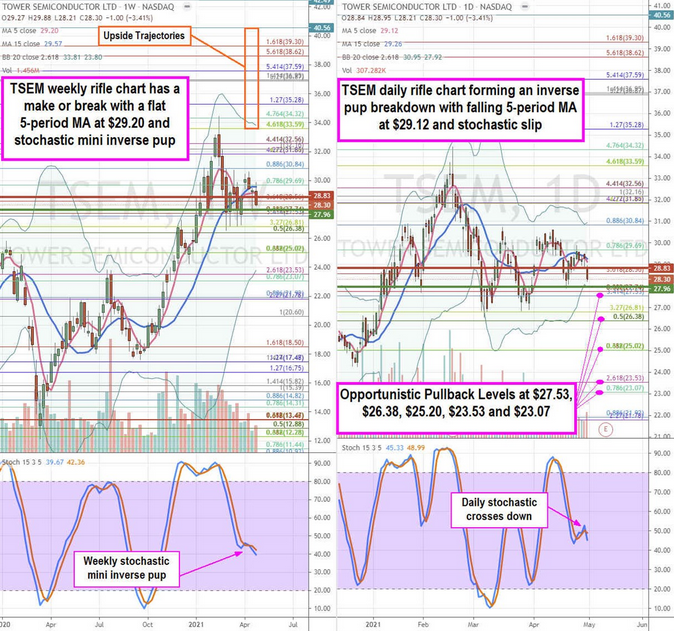
Using the rifle charts on the weekly and daily time frames provides a near-term view of the playing field for TSEM shares. The weekly rifle chart peaked at the $34.32 Fibonacci (fib) level and formed a weekly market structure high (MSH) sell triggering on the breakdown below $28.83. The weekly pup breakout attempt abruptly collapsed as share fell below the weekly 5-period moving average (MA) at $29.20 as stochastic crossed back down in a mini inverse pup. The daily rifle chart is forming an inverse pup breakdown with a falling 5-period MA at $29.12 preparing to challenge the market structure low (MSL) buy trigger at $27.96. The daily stochastic originally formed a mini pup attempt that crossed back down forcefully. This is sets up opportunistic pullback levels at the $27.53 fib, $26.38 fib, $25.20 fib, $23.53 fib, and the $23.07 fib. The upside trajectories range from the $33.59 up towards the $40.56 level.
