- India
- International
Tuesday, Apr 16, 2024
Journalism of Courage
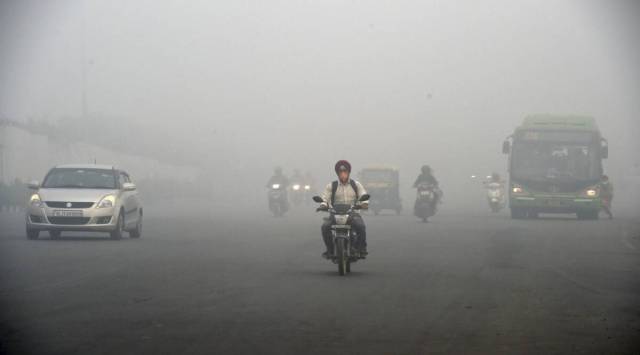 Areas apart from the 13 pre-determined hotspots have also recorded high pollution levels in November, featuring on the CPCB’s daily list. (File)
In November, Jahangirpuri consistently featured as a ‘hotspot’ on the Central Pollution Control Board’s (CPCB) daily list of air pollution hotspots – five areas with the highest AQI on the day. Till November 29, Jahangirpuri was on the daily list of hotspots for 24 days, with the AQI at the monitoring station far exceeding the city’s average for those days.
On November 4, for instance, Jahangirpuri recorded an AQI of 453, while Delhi’s average AQI on the day was 382. On November 12, the Jahangirpuri station recorded an AQI of 495, the highest AQI recorded by any station in November, going by CPCB data. The average AQI for these 24 days at Jahangirpuri was 438.
A total of 13 ‘hotspots’ were identified by the CPCB and the Delhi Pollution Control Committee (DPCC) a few years ago. The hotspots are Narela, Bawana, Mundka, Vivek Vihar, Wazirpur, Rohini, RK Puram, Okhla Phase-2, Ashok Vihar, Jahangirpuri, Anand Vihar, Punjabi Bagh and Dwarka Sector-8. These hotspots were found to have higher air pollution levels, measured in terms of annual average PM10 and PM2.5 levels, when compared to other areas.
Wazirpur was on the list of five areas with the highest AQI in the city on 21 days in November. The average AQI for these 21 days at the Wazirpur monitoring station was 418.
The average PM2.5 levels for winter at some of these hotspots (till November 30) has already surpassed the average levels for all of winter (October to February) for some of the previous years, according to data from the Centre for Science and Environment (CSE). At Jahangirpuri, the average PM2.5 level for winter this year so far was 202 µg/m3, more than 195 µg/m3 for all of winter in 2019, but lower than 248 µg/m3 in 2020 and 229 µg/m3 in 2018.

At Narela, the average PM2.5 level this winter so far was 191 µg/m3, higher than 155 µg/m3 for all of winter 2019, 189 µg/m3 in 2018, and 160 µg/m3 in 2017, but lower than 196 µg/m3 for winter 2020. Wazirpur recorded an average of 182 µg/m3 so far, higher than the winter of 2020 which recorded 161 µg/m3. Wazirpur has recorded a lower average this year, so far, than 2019 which recorded 202 µg/m3 and 2018 which saw 239 µg/m3.
No specific measures were announced for these hotspots this year, apart from Environment Minister Gopal Rai saying that the fire brigade’s water spraying systems will be pressed into service at the hotspots to deal with dust.
Areas apart from the 13 pre-determined hotspots have also recorded high pollution levels in November, featuring on the CPCB’s daily list. Chandni Chowk, for instance, has been on the list of five hotspots with the highest daily AQI on four days this month. On Nov 12, the AQI at Chandni Chowk stood at 494, second only to Jahangirpuri, and on par with Mundka and Wazirpur, which were already classified as air pollution hotspots. Shadipur, meanwhile, was listed as a hotspot on seven days in November.
Going by CPCB data, the air quality in Jahangirpuri began to deteriorate in October. The monitoring station recorded the first ‘poor’ air day on October 11, followed by a string of ‘poor’ air days till October 17. The Jahangirpuri station recorded its first ‘very poor’ air day on October 29.
According to the CPCB’s winter inspections between October 20 and November 17, the major sources of pollution at Jahangirpuri were industrial waste dumping, garbage burning, unpaved roads, emissions from denting and painting of vehicles and traffic congestion.
“Micro-level action becomes important for localised pollution problems. We can then define strategies and address it locally. Region-wide action for NCR will also require mapping of these dispersed sources of pollution – waste burning, construction, unpaved roads,” said Anumita Roychowdhury, Executive Director, Research and Advocacy, CSE.
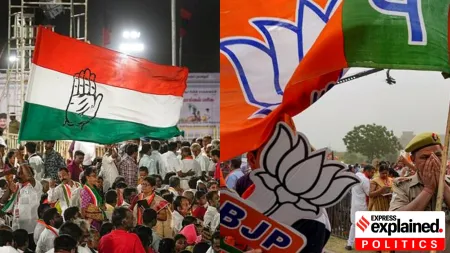
The story of party symbols in Indian electionsSubscriber Only

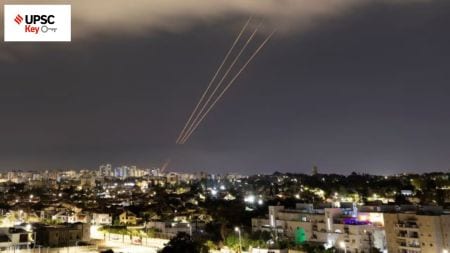
Explained: A short history of Iran-Israel ties and why theySubscriber Only
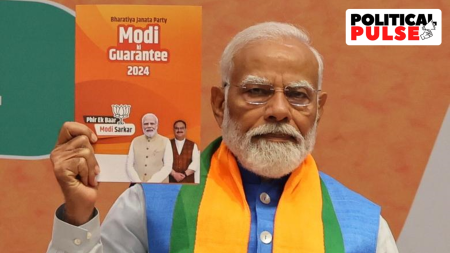
10 years on, BJP manifesto signals continuity amid changeSubscriber Only
AAP Bharuch candidate's frontline fighters are his two wivesSubscriber Only

K-beauty boom: Do Korean creams really work on Indian skin?Subscriber Only
Idea Exchange with Political scientist John J MearsheimerSubscriber Only
No real buzz for BJP in western UP, but OppositionSubscriber Only
Why the swanky Surat Diamond Bourse is struggling to attractSubscriber Only