- India
- International
Friday, Apr 19, 2024
Journalism of Courage
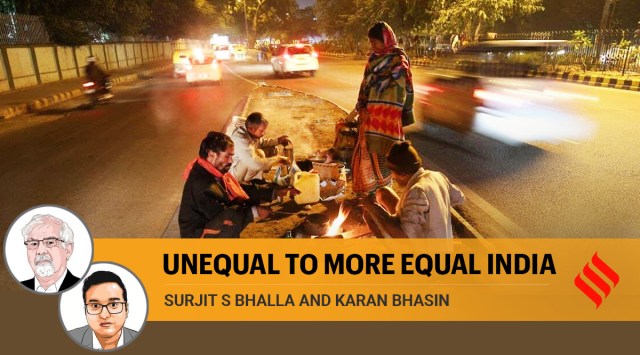 A family cooks dinner on a roadside in New Delhi. (Express Photo: Amit Mehra, File)
The release of the NFHS data (and the Niti Aayog’s study on developing a multi-dimensional index of poverty — MPI) has led to a considerable amount of discussion, and justifiably so. The key to understanding progress and development is to recognise the basic parameters of improvement, and to do so across multiple dimensions.
MPI indices are the third in the series of global studies on poverty. Global studies started with the World Bank’s income/consumption-based measure of absolute poverty. The UN expanded the monetary index adding health and education indicators via the Human Development Index (HDI). The MPI is an Oxford-based initiative that develops an exclusive broadly non-monetary living standard index of poverty.
The detailed Niti Aayog study is a rich source of data and analysis for one year — 2015-16. Data are also reported for 2019-21, but a proper analysis will come later when unit-level data are available. These data are useful for obtaining a snapshot at a point in time. Like with the other poverty indices (World Bank and HDI), most information and useful policy analysis comes via a study of the inter-temporal evolution of poverty. A snapshot frozen in time is just that — information about a point and not about the evolution over points in time.
Unfortunately, as revealed by expert commentary in recent days, one year (one point) information is used to derive inferences about trends in time — a strict no-no. In an article, Ajit Ranade presents little analysis of the change in inequality but lots of static 2015-16 evidence: “A large state like Uttar Pradesh… has 37.8 per cent of the population below MPI poverty level; at the other extreme is Kerala with 0.71 per cent of the population below MPI poverty.” Ranade acknowledges that regional inequality has existed for some time, but he argues that poverty incidence across Indian states even as per the MPI is astoundingly unequal. Again, the question is what has happened over time — not that they have equalised, but have development outcomes converged or have they diverged?
T N Ninan talks about the simultaneous existence of Africa’s Sahel region and the Philippines in India. He finds that the two Indias are not getting any closer. Indeed, India’s development trajectory has not been uniform, but the regional imbalance of development cannot be viewed at a fixed point in time.

In a detailed examination of the summary statistics reported in the NFHS data (large and small states of India for the two years 2015-16 and 2019-21), we find quite the opposite result. A remarkable convergence in living standards, a convergence possibly unparalleled in Indian history and in the space of just five years. The first year of the comparison 2015-16 can be taken to be a reasonable proxy for the beginning of the Modi model of development — a model which can be described as targeted purposeful development. A model which recognises the separate roles played by the “market” (bringing about increases in personal income) and by quasi-public goods efficiently targeted by informed public policy. (We — jointly with Arvind Virmani — present a detailed analysis of the evidence in “Inclusive Growth as Public Good: Poverty, Inequality and Growth in India”, forthcoming — based on our earlier 2019 NCAER presentation.)
NFHS reports the averages for all states, and for 131 variables, for two years 2015-16 and 2020-21. Seventeen of these 131 welfare indicators are used by us to construct indices under four classifications. The first classification concerns itself with the improvement in the lives of girls/women (five indicators, for example, sex ratio, fertility, female education). The second bucket consists of housing conditions (three indicators, for example, improved sanitation, clean fuel). The third list consists of children’s welfare (four indicators such as adequate diet, stunting) and the fourth classification includes women’s empowerment (five indicators, for example, owning a house, less spousal violence). Given that Niti Aayog’s report primarily relies on the NFHS-4, we use their findings as the baseline scenario to evaluate the delta — that is, the per cent change in indicators between NFHS-4 and NFHS-5.
The table reports the results for several states. The states are separated into poor and rich states, approximating the erstwhile BIMARU states plus a few more. Data for three rich states — Kerala, Punjab and Tamil Nadu — are also presented to study differential growth in indicators (convergence/divergence?). Each of the indicators, for each state and time, has a value between 0 and 100 — zero for the worst and 100 for the best, and the value for the others represented by the ratio: Numerator is the absolute distance between the indicator value and the minimum/maximum and the denominator is the difference between the maximum and the minimum.
 Transforming, converging, equalising India
Seventeen indicators imply a maximum possible score of 1,700. Kerala performs the best with an aggregate index of 1,300 in NFHS-5 — a very small 1.5 per cent increase from its 2015-16 value. In contrast, Bihar increases its index by 56 per cent. Punjab does better than Tamil Nadu and today has a higher index – 1,240 versus 1,178 in 2020-21. UP (along with Rajasthan and MP) performs the best — a 60 plus per cent increase in the welfare index, more than five times the increase in the rich states.
We are in the process of aggregating the index across a wider range of indicators. It is unlikely that the basic result will change — a large 31 per cent increase in the aggregate level of development, and a very large decline — 41 per cent — in inequality of development, as represented by the Gini. For female empowerment, the increase in levels is an astounding 48 per cent, and a more than halving in the Gini.

This is not convergence, but strong convergence. Higher improvement by less developed states is evidence in support of catch-up, which suggests that regional imbalances are reducing, and in some indicators, rapidly so. The results are consistent across most indicators. States such as UP, Bihar and Jharkhand are fast approaching similar standards for select indicators as some of the “developed” states.
This acceleration in catch up is no coincidence, but rather an outcome of an approach that involves targeted interventions to improve developmental outcomes. Take the issue of challenges associated with lack of access to modern sanitation — this was directly addressed by the construction of 110 million toilets. Similarly, the problem of asthma due to indoor air pollution generated by incomplete combustion of wood used for cooking was addressed by the PM Ujjwala Yojana which provided 86 million LPG connections.
The approach was not just limited to sanitation, proper fuel or electricity — interventions that are targeted to an individual household — but also to the holistic development of an entire region. This was the central theme behind the identification of the most backward districts of the country and targeting public resources to help them catch up with the India growth story.
India has been, and was, not one but several Indias. What is remarkable about its recent history is the rapid process of uneven change — where progress is considerably higher for the poorer states — the convergent, and inclusive pattern of development. That is the real story behind the NFHS-4 and NFHS-5 numbers.
This column first appeared in the print edition on December 4, 2021 under the title ‘Unequal to more equal India’.
Bhalla is Executive Director IMF representing India, Sri Lanka, Bangladesh and Bhutan. Bhasin is a New York-based graduate student. The views expressed are those of the authors and do not necessarily represent the views of the IMF, its Executive Board, or IMF management.
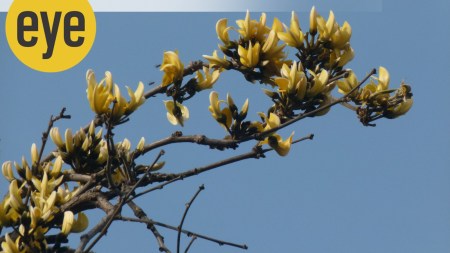
Is there hope for India’s dying wastelands?Subscriber Only
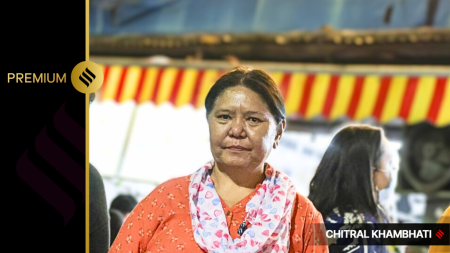
The momo story: How Dolma Aunty fought for her brandSubscriber Only

Mehsampur: An angrier alternative to Imtiaz Ali's ChamkilaSubscriber Only
Jharkhand Academic Council (JAC) will declare the Class 10 results today (April 19) on their official websites. Students can access their scorecards by entering their login details on jac.nic.in, jharresults.nic.in, or jac.jharkhand.gov.in. The marksheet will include personal details, subject-wise marks, and a cumulative score. Last year, the pass percentage was 95.38%.