


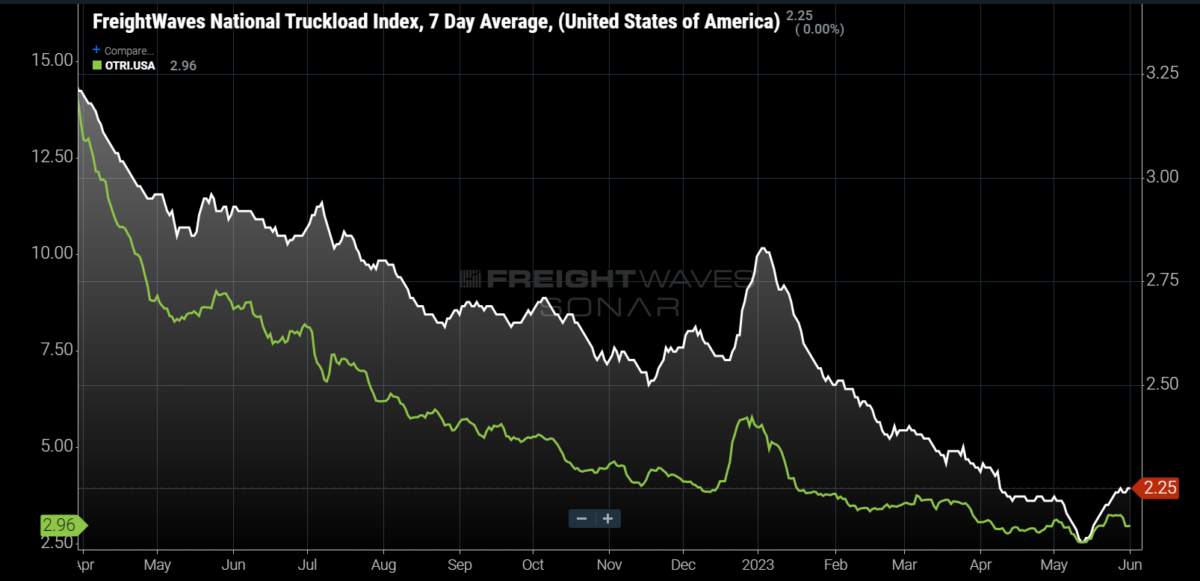
Chart of the Week: National Truckload Index, Outbound Tender Rejection Index – USA SONAR: NTI.USA, OTRI.USA
Truckload spot rates increased marginally compared to month-ago levels while tender rejection rates barely moved over the last two weeks of May, providing little hope to transportation providers that capacity has corrected noticeably.
The National Truckload Index (NTI), which measures average spot rates for dry van loads moving more than 250 miles nationwide, did jump significantly when compared to mid-May levels, but was only up 3 cents per mile (1%) from where it started the month.
The national Outbound Tender Rejection Index (OTRI), which measures how often carriers turn down load requests from their contract customers, only barely moved back over 3% for a few days at the end of the month — values under 4% are indicative of extremely soft/loose environments.
To put this into perspective, capacity tends to tighten around Memorial Day, pushing rejection and spot rates higher. Both indexes have shown increases on some level around the holiday since they were created from the years before and during the pandemic. The levels of increase have varied widely.
Some within the industry expected Roadcheck week and Memorial Day to be the inflection point that signaled the bottom of the market was behind us. There is some argument to be made looking at current trends that demand has potentially hit a floor. (The jury is still out on this one.) It is still too early to say that the market will be easier to navigate for transportation providers.
As mentioned in an earlier article, it will take a while for capacity to exit the domestic truckload market. Carriers were handling 22% more freight at the end of 2021 than they did this past week, according to the Contract Load Accepted Volume Index (CLAV).

The CLAV measures loads that carriers accepted and moved for their contracted customers. Considering many carriers also had some percentage of their capacity on the spot market, this number is probably understated in terms of their capabilities.
The CLAV is biased toward larger fleets with electronic tendering capabilities. This sector has largely been growing their fleet sizes by acquiring other operations that are struggling — smaller operators have been feeling the brunt of this downturn the most. This process keeps capacity in the market longer.
So what happens next?
There are no quick fixes to this market. Looking at revocations and exits are not sufficient in telling you with any precision when this market will tighten as smaller operators are gobbled up. Spot rates can also be deceiving due to increased demand for expedited or guaranteed services around holidays, which can increase rates without being true reductions to capacity.
Rejection rates are much more revealing in terms of when the market has started to become sustainably tighter. If demand conditions remain stable (a big if) rejection rates should pulse higher around each holiday period.
July 4 is traditionally the summer peak in terms of demand and spot market activity, although Labor Day took that title during the pandemic years. Spot and rejection rates tend to be more responsive to that holiday than Memorial Day. If rejection rates stay below 4%, it will be a sign that conditions have not changed significantly.
About the Chart of the Week
The FreightWaves Chart of the Week is a chart selection from SONAR that provides an interesting data point to describe the state of the freight markets. A chart is chosen from thousands of potential charts on SONAR to help participants visualize the freight market in real time. Each week a Market Expert will post a chart, along with commentary, live on the front page. After that, the Chart of the Week will be archived on FreightWaves.com for future reference.
SONAR aggregates data from hundreds of sources, presenting the data in charts and maps and providing commentary on what freight market experts want to know about the industry in real time.
The FreightWaves data science and product teams are releasing new datasets each week and enhancing the client experience.
To request a SONAR demo, click here.
