
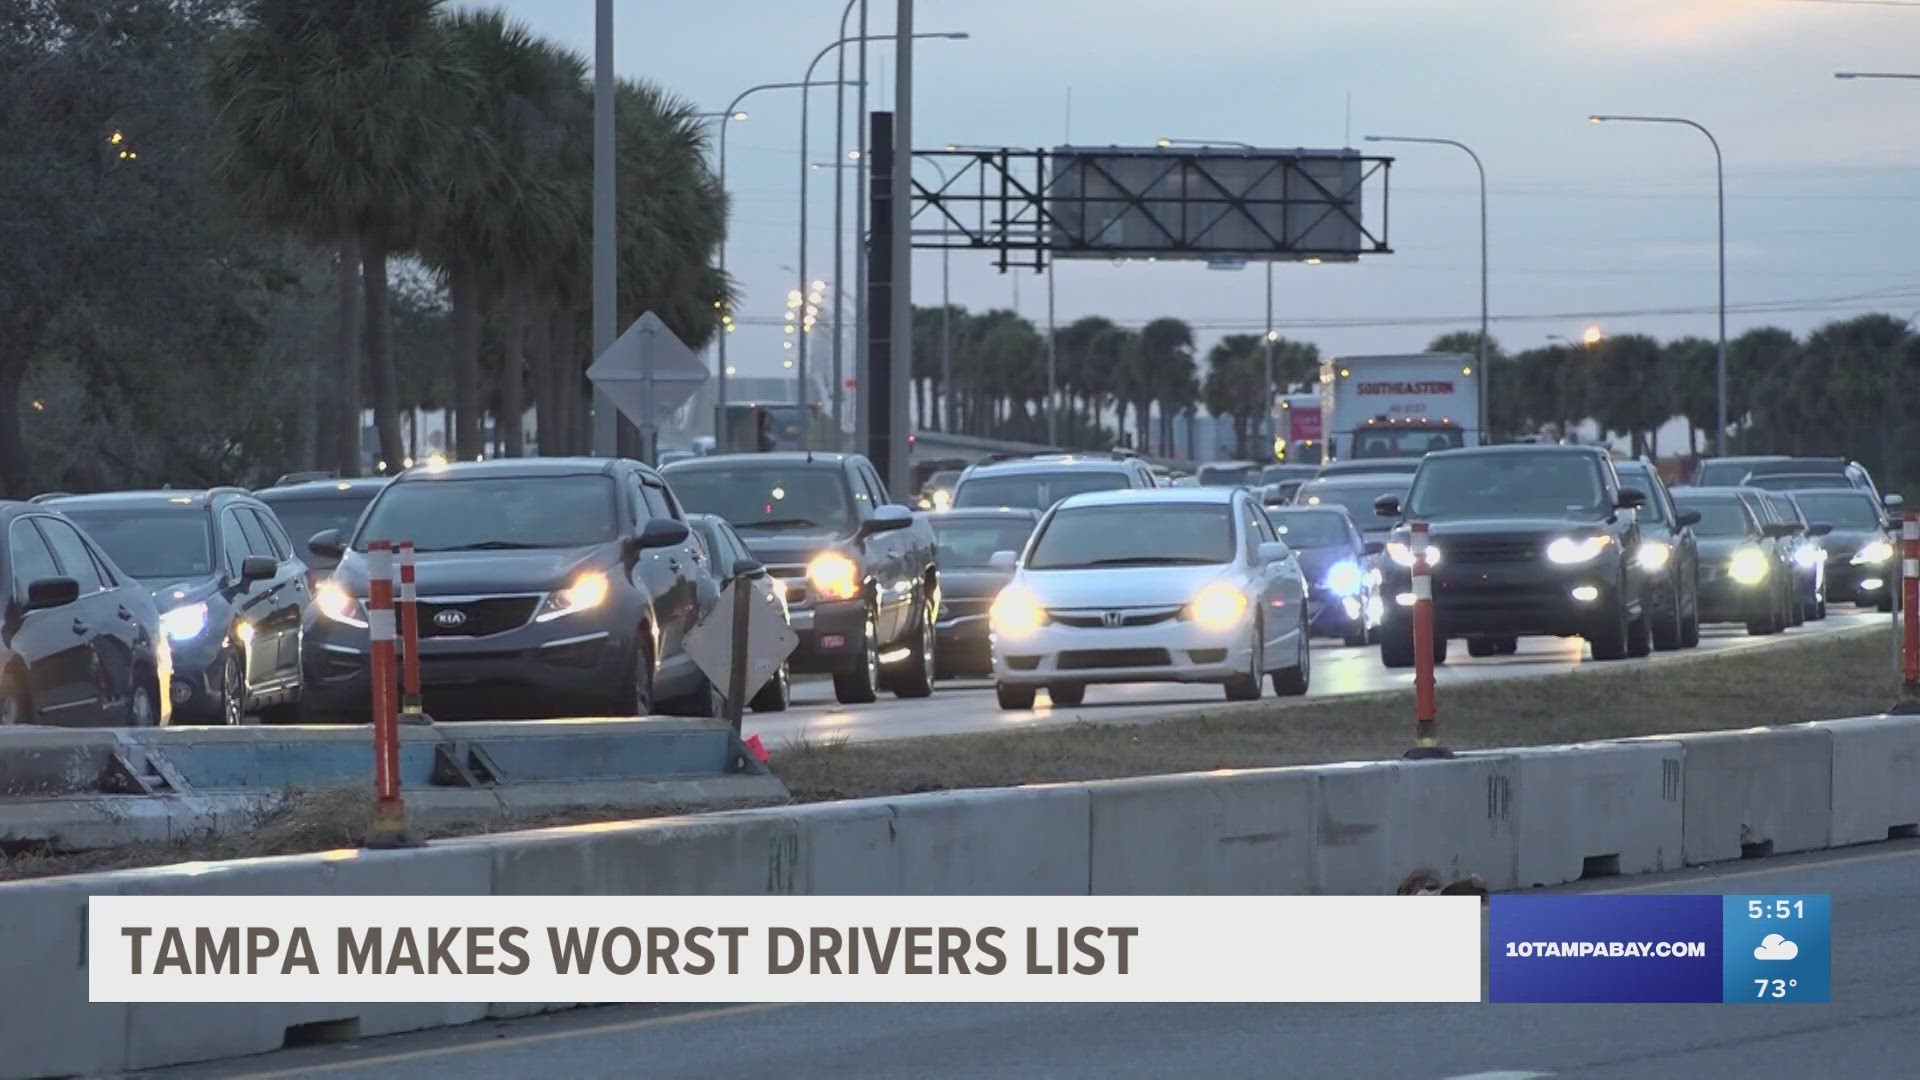
TAMPA, Fla. — If you’re unhappy with the traffic during your commute or even when you’re driving to the supermarket, you’re not alone.
Forbes ranked three Florida cities among the top 25 worst cities to drive in. Miami came in second, Jacksonville in 16th and Tampa in 24th.
The destinations were scored based on four categories: driving experience, safety, cost of car ownership and access to car maintenance.
Tampa’s score
The city scored 61.17 out of 100 overall with 100 being the worst. The driving experience score was 44.77, the safety score was 54.42, the cost of car ownership score was 72.51 and the access to car maintenance score was 22.93.
On the other hand, Miami scored poorly because of its high insurance, prices, long commutes and slow rush hour speeds, according to Forbes. It ranked third worst for the overall cost of car ownership and sixth worst for overall driving experience.
It takes a driver in Miami 15 minutes to travel six miles, according to the study.
Why is there so much congestion?
During the springtime, residents see an increase in congestion because of seasonal residents and tourists visiting places like beaches for spring break.
There also has been an influx of people moving to the Tampa Bay area. Hillsborough County saw an increase of more than 20,000 in population from July 2022 to July 2023, according to the U.S. Census Bureau.
The Tampa, St. Petersburg and Clearwater areas experienced a notable population gain between 2022 and 2023 with more than 50,000 more people, according to data from the agency. The region was one of the five fastest-growing metro areas in that period of time.
What is being done to relieve issues?
There are multiple traffic projects around the area working to improve traffic.
The Gateway Expressway is one of the latest, set to open on April 26 after years in the making. This will be a direct connection between U.S. Highway 19 and Interstate 275 in Pinellas County, leading to the Howard Frankland Bridge into Hillsborough or further south into Pinellas to the Sunshine Skyway Bridge.
The new toll roads and express lanes are set to open later this month, according to the Florida Department of Transportation. The projects will have multiple new four-lane tolled expressways and express lanes. This will allow drivers to avoid taking busy roads with traffic lights.
Another construction project is the makeover of the Howard Frankland Bridge. It started in 2020 to create more lanes to accommodate drivers. Once finished, it will have eight lanes.
Nicknamed the "malfunction junction," the Downtown Tampa Interchange project is also in the works creating more lanes, widening ramps and widening shoulders for I-275 and I-4. Expected to be completed in 2027, it will also change exits to relocate access to streets and add new exit ramps.
A full breakdown of the projects is available here.
The full list
- Oakland, CA
- Miami, FL
- San Francisco, CA
- Houston, TX
- Philadelphia, PA
- New York City, NY
- Chicago, IL
- Atlanta, GA
- Dallas, TX
- Portland, OR
- Los Angeles, CA
- Baltimore, MD
- Washington D.C.
- Denver, CO
- Boston, MA
- Las Vegas, NV
- For Worth, TX
- Seattle, WA
- Louisville, KY (tied for 18)
- Long Beach, CA
- Austin, TX
- Jacksonville, FL
- Sacramento, CA
- Tampa, FL
- Memphis, TN
How was the list made?
Forbes Advisor used data to compare cities using 15 metrics across four categories. Data came from the INRIX 2022 Global Traffic Scorecard, 2022 TomTom Traffic Index, the Census Bureau, the Department of Energy, AAA, the National Insurance Crime Bureau and other agencies.
Here are the metrics used:
Driving experience
Number of hours lost in traffic congestion per year
Average speed in rush hour traffic
Average amount of time required to travel 6 miles
Average speed in downtown
Average commute time
Average number of days with precipitation
Safety
Number of fatal car accidents per 100,000 city residents
Number of car thefts per 100,000 residents
Cost of car ownership
Average annual car insurance premium
Amount of money spent on gas due to congestion per year
Average gas prices
Access to car maintenance
Number of car repair shops per 10,000 metro area residents
Number of car washes per 10,000 metro area residents
Number of parking lots and parking garages per 100,000 metro area residents
Number of electric vehicle charging stations per 10,000 city residents